
- Visible columns
- Column order
- Pinned columns
- Sorting
- Grouping
- Saved views
Your grid layout — visible columns, order, sorting, grouping, and filters — autosaves as you work, with a confirmation in the status line at the top of the grid. There’s no “Leave site? Changes you made may not be saved” prompt to worry about. Views (see step 7) are for naming and switching between distinct saved layouts, not for avoiding lost work.
Search the grid
Use the grid search box to find a product by any attribute — SKU, name, brand, EAN, supplier, category, or any custom field — without building a filter. Type a value and the grid narrows to matching rows instantly. Clear the search to return to the full set.1. Select visible columns
You can show or hide any column.How to do it
- Click Columns in the top toolbar
- Use the search field to find a column
- Click the eye icon to:
- Show column
- Hide column
- You can also use Hide All if you want to rebuild the layout from scratch
Column type icons
Each column header shows a small icon indicating its type:- Editable — manually entered values you can change row by row.
- Formula — calculated from other columns; values update automatically.
- AI-generated — populated by a Retailgrid AI action (e.g. enrichment, classification).
Best practice
Keep only what you need for the task.Example for pricing work:
- Product Name
- Price
- Unit Cost
- Margin
- Competitor Price
- Status
Visible columns

2. Order columns by drag and drop
You can rearrange columns freely.How to do it
- Click and hold a column header
- Drag it left or right
- Drop it where you want it
Recommended layout
Left (fixed reference):- Product Name
- Product ID
- Price
- Unit Cost
- Margin
- Elasticity
- Brand
- Category
- Manufacturer
3. Pin columns
Pinning keeps important columns visible while scrolling.How to pin
- Click the three-dot menu on a column header
- Select Pin Column
- Choose:
- Pin Left
- Pin Right
When to use
Pin Left:- Product Name
- SKU
- Status
- Actions
Pin column
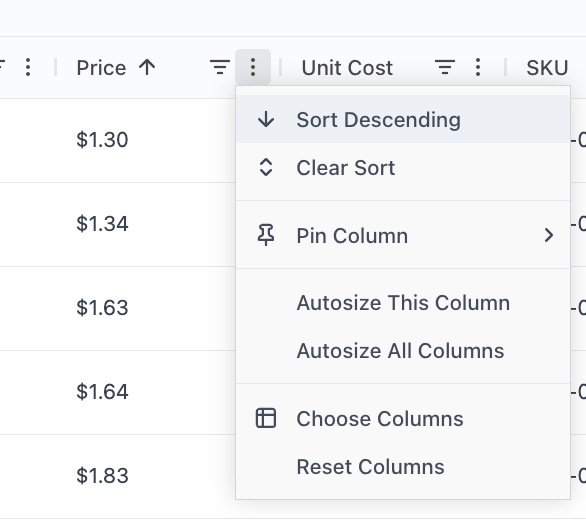
4. Sort values
You can sort any column.How to sort
- Click column header to toggle ascending / descending
OR - Use the column menu → Sort Ascending / Descending
Example use cases
- Sort by Price Descending → find premium items
- Sort by Unit Cost Descending → detect cost risk
- Sort by Margin Ascending → identify weak SKUs
Sorting

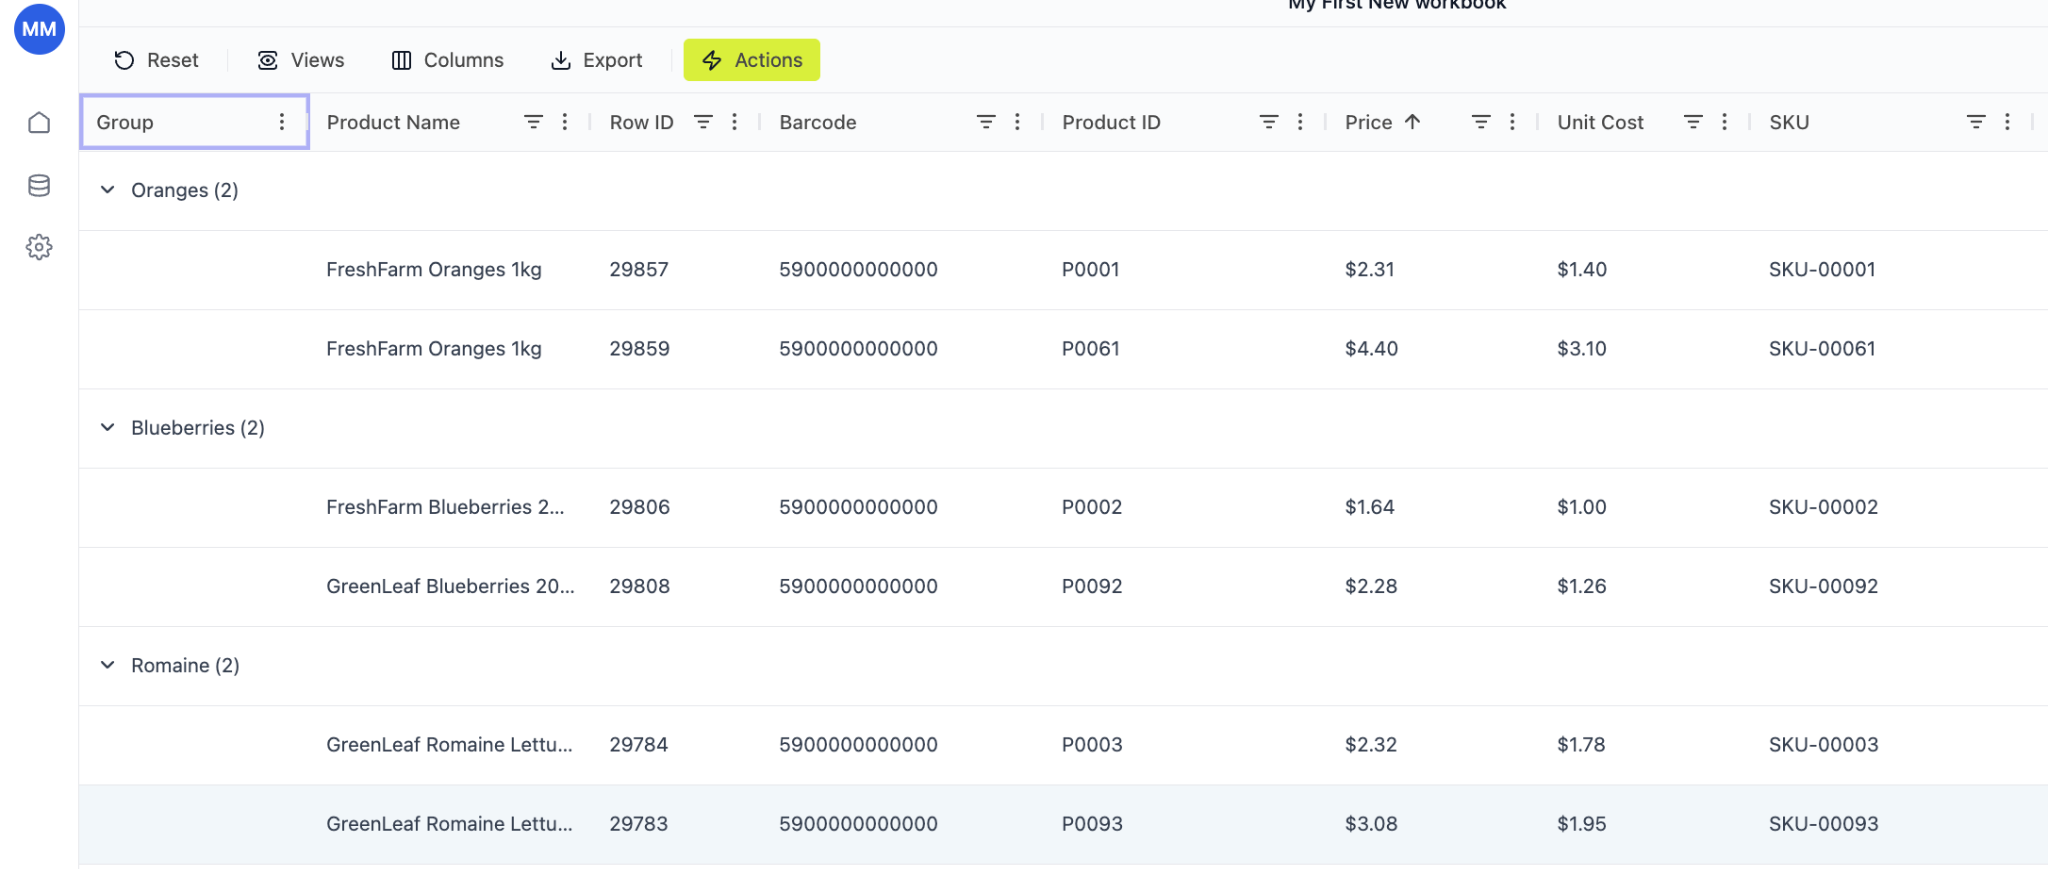
5. Group products
Grouping lets you analyze structured segments.How to group
- Drag a column into the grouping area (if enabled)
OR - Use the Group column (if preconfigured)
- Group by Product Group
- Group by Brand
- Group by Category
- Oranges (2)
- Blueberries (2)
- Romaine (2)
Why grouping matters
- Compare pricing inside category
- Spot inconsistencies
- Review margin distribution by group
Value aggregation per column
When grouping is active, each numeric column rolls up to a single value per group. Retailgrid picks a sensible default based on the column’s semantic type — Sales sums, Price and Margin average, Product ID counts. Aggregation runs on the backend so the rolled-up values stay correct and consistent across any grid size. To override the default, open the column header’s three-dot menu → Value Aggregation and pick fromNone, Sum, Average, Min, Max, Count. Your override is per-column and persists with the grid view.
Group
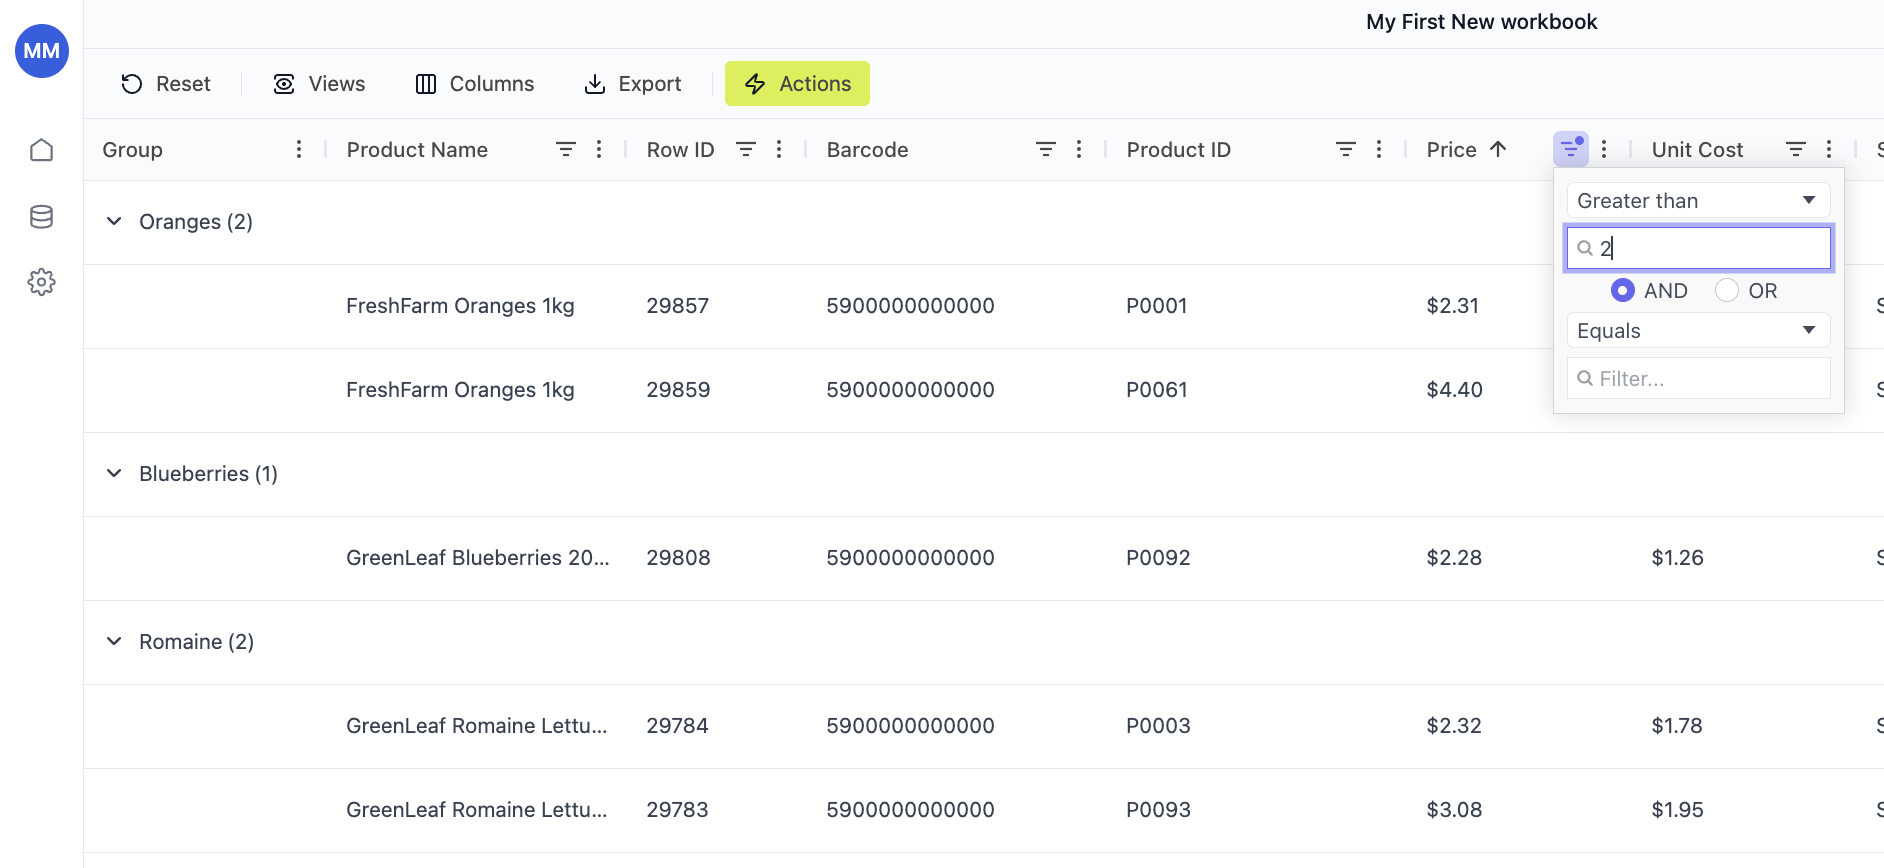
6. Filter columns
Filtering allows you to narrow down products based on specific criteria — instantly focusing on what matters. You can filter any column (numeric, text, status, etc.).How to apply a filter
- Click the filter icon in the column header
- Choose a condition from the dropdown
- Enter your filter value
- The grid updates immediately
Numeric filters (price, cost, margin, etc.)
For numeric columns, you can use:- Greater than
- Less than
- Equals
- Not equal
- Between
Example
- Price Greater than 2
- Unit Cost Less than 3
- Margin Below 20%
- AND
- OR
- Price > 2 AND Price < 5
Text filters (brand, product name, SKU, etc.)
For text columns, you can filter by:- Contains
- Equals
- Starts with
- Ends with
Example
- Brand equals Arla
- Product Name contains Greek
Filtering
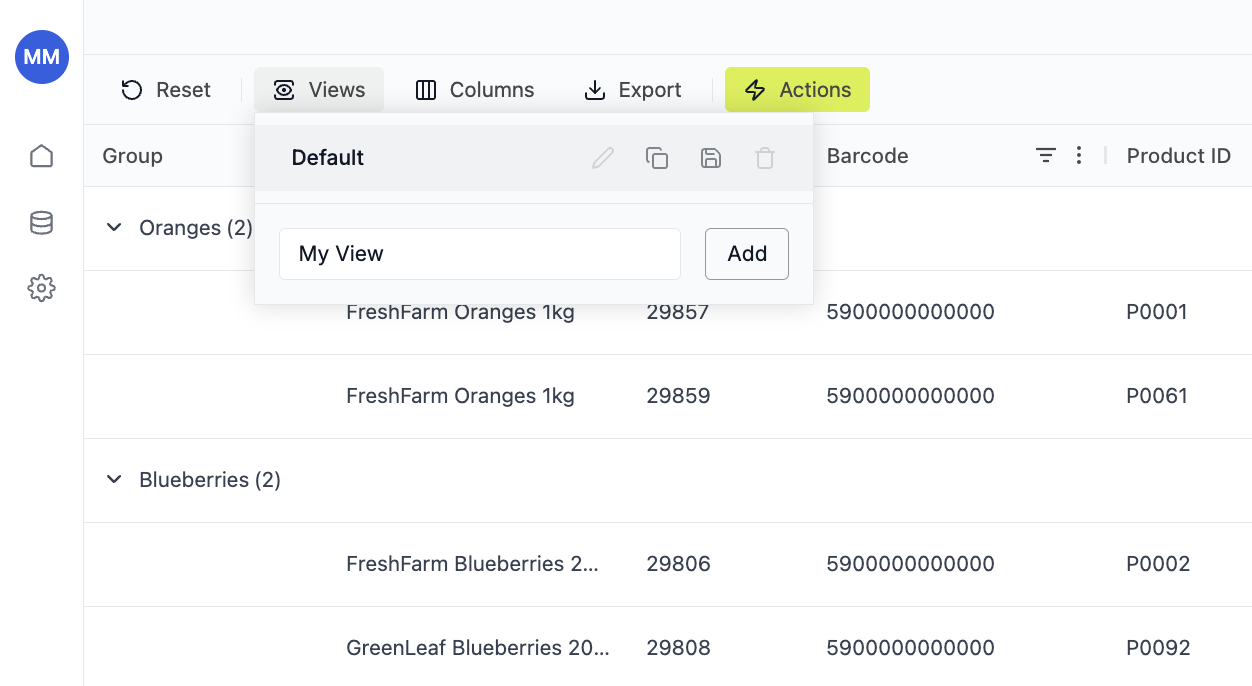
7. Save view as default or create your own view
Once your layout is configured, save it as a named view to switch back to later. (Your working layout already autosaves — named views are for keeping several distinct setups side by side.)How to save
- Click Views in the toolbar
- Enter a name (e.g., “Margin Analysis”)
- Click Add
- Keep Default view
- Create multiple custom views
- Switch between them instantly
Example saved views
| View Name | Purpose |
|---|---|
| Margin Review | Price, Cost, Margin columns |
| Competitive View | Price, Competitor Price, CPI |
| Operations | SKU, Barcode, Status |
| Elasticity | Elasticity, Revenue, Price Δ |