

What is a grid?
A Grid is:- A filtered subset of your product catalog
- A working environment for pricing and analysis
- A place to run agents, apply rules, and export results
- A specific brand (e.g., Arla)
- A category (e.g., Dairy)
- A campaign
- A pricing experiment
- A country or channel
Step 1. Go to grid
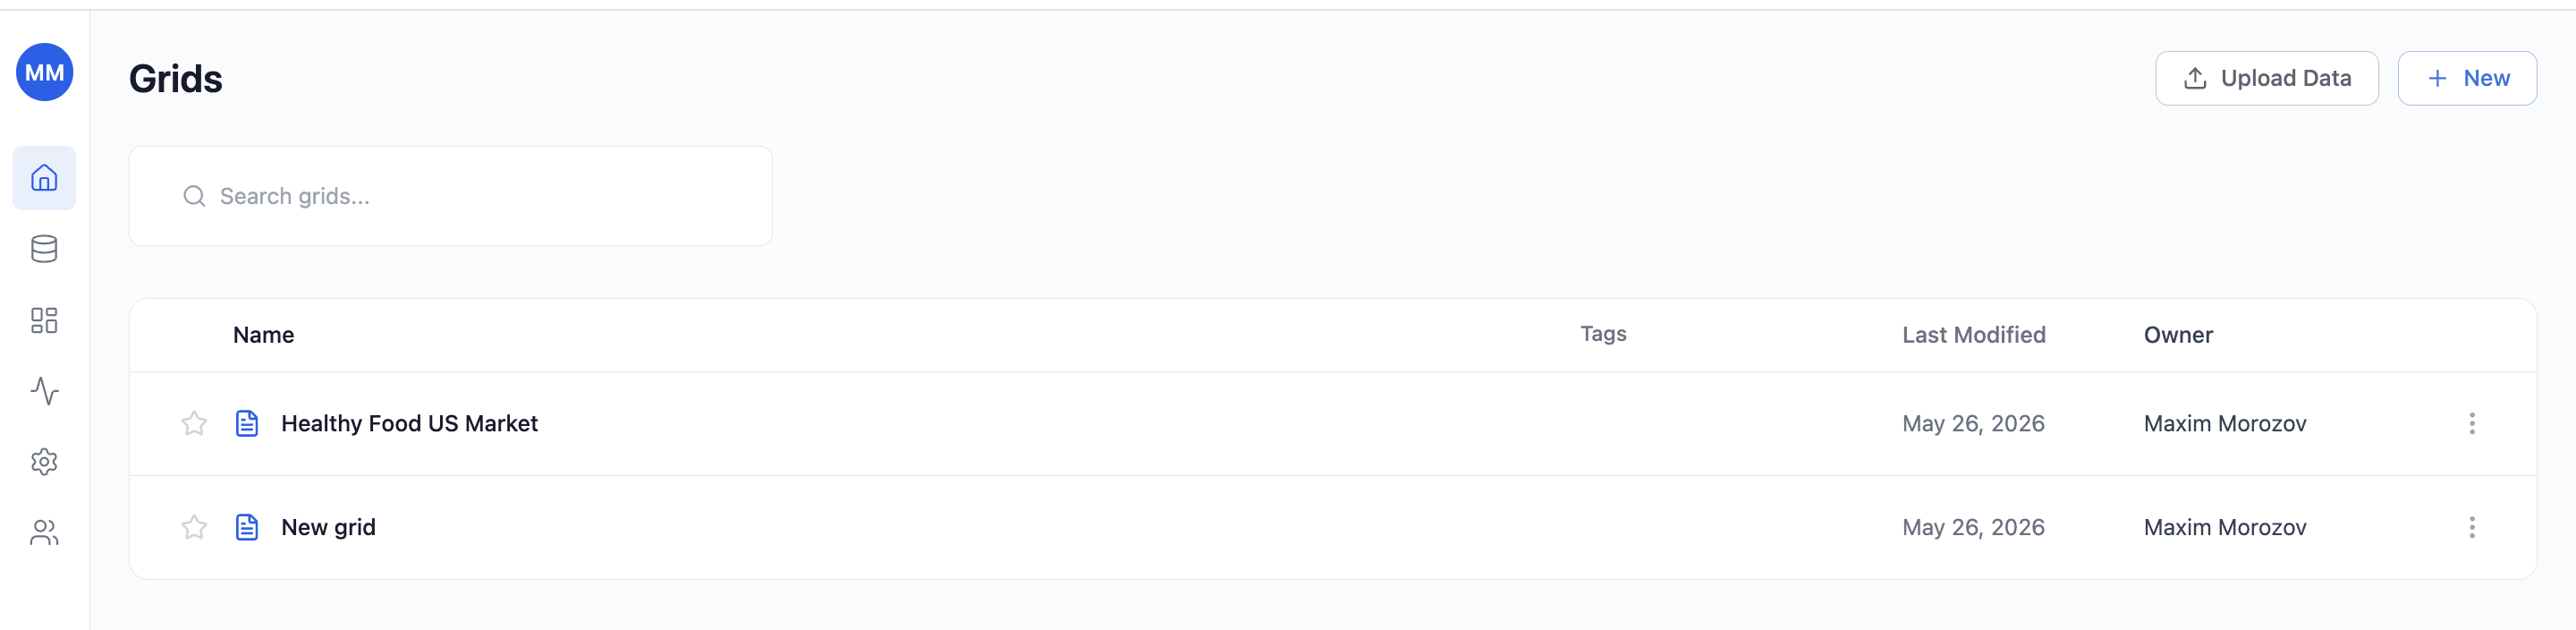
From the main navigation:- Click Grids
- Click + New (top right)
Grids view
Step 2. Name your grid
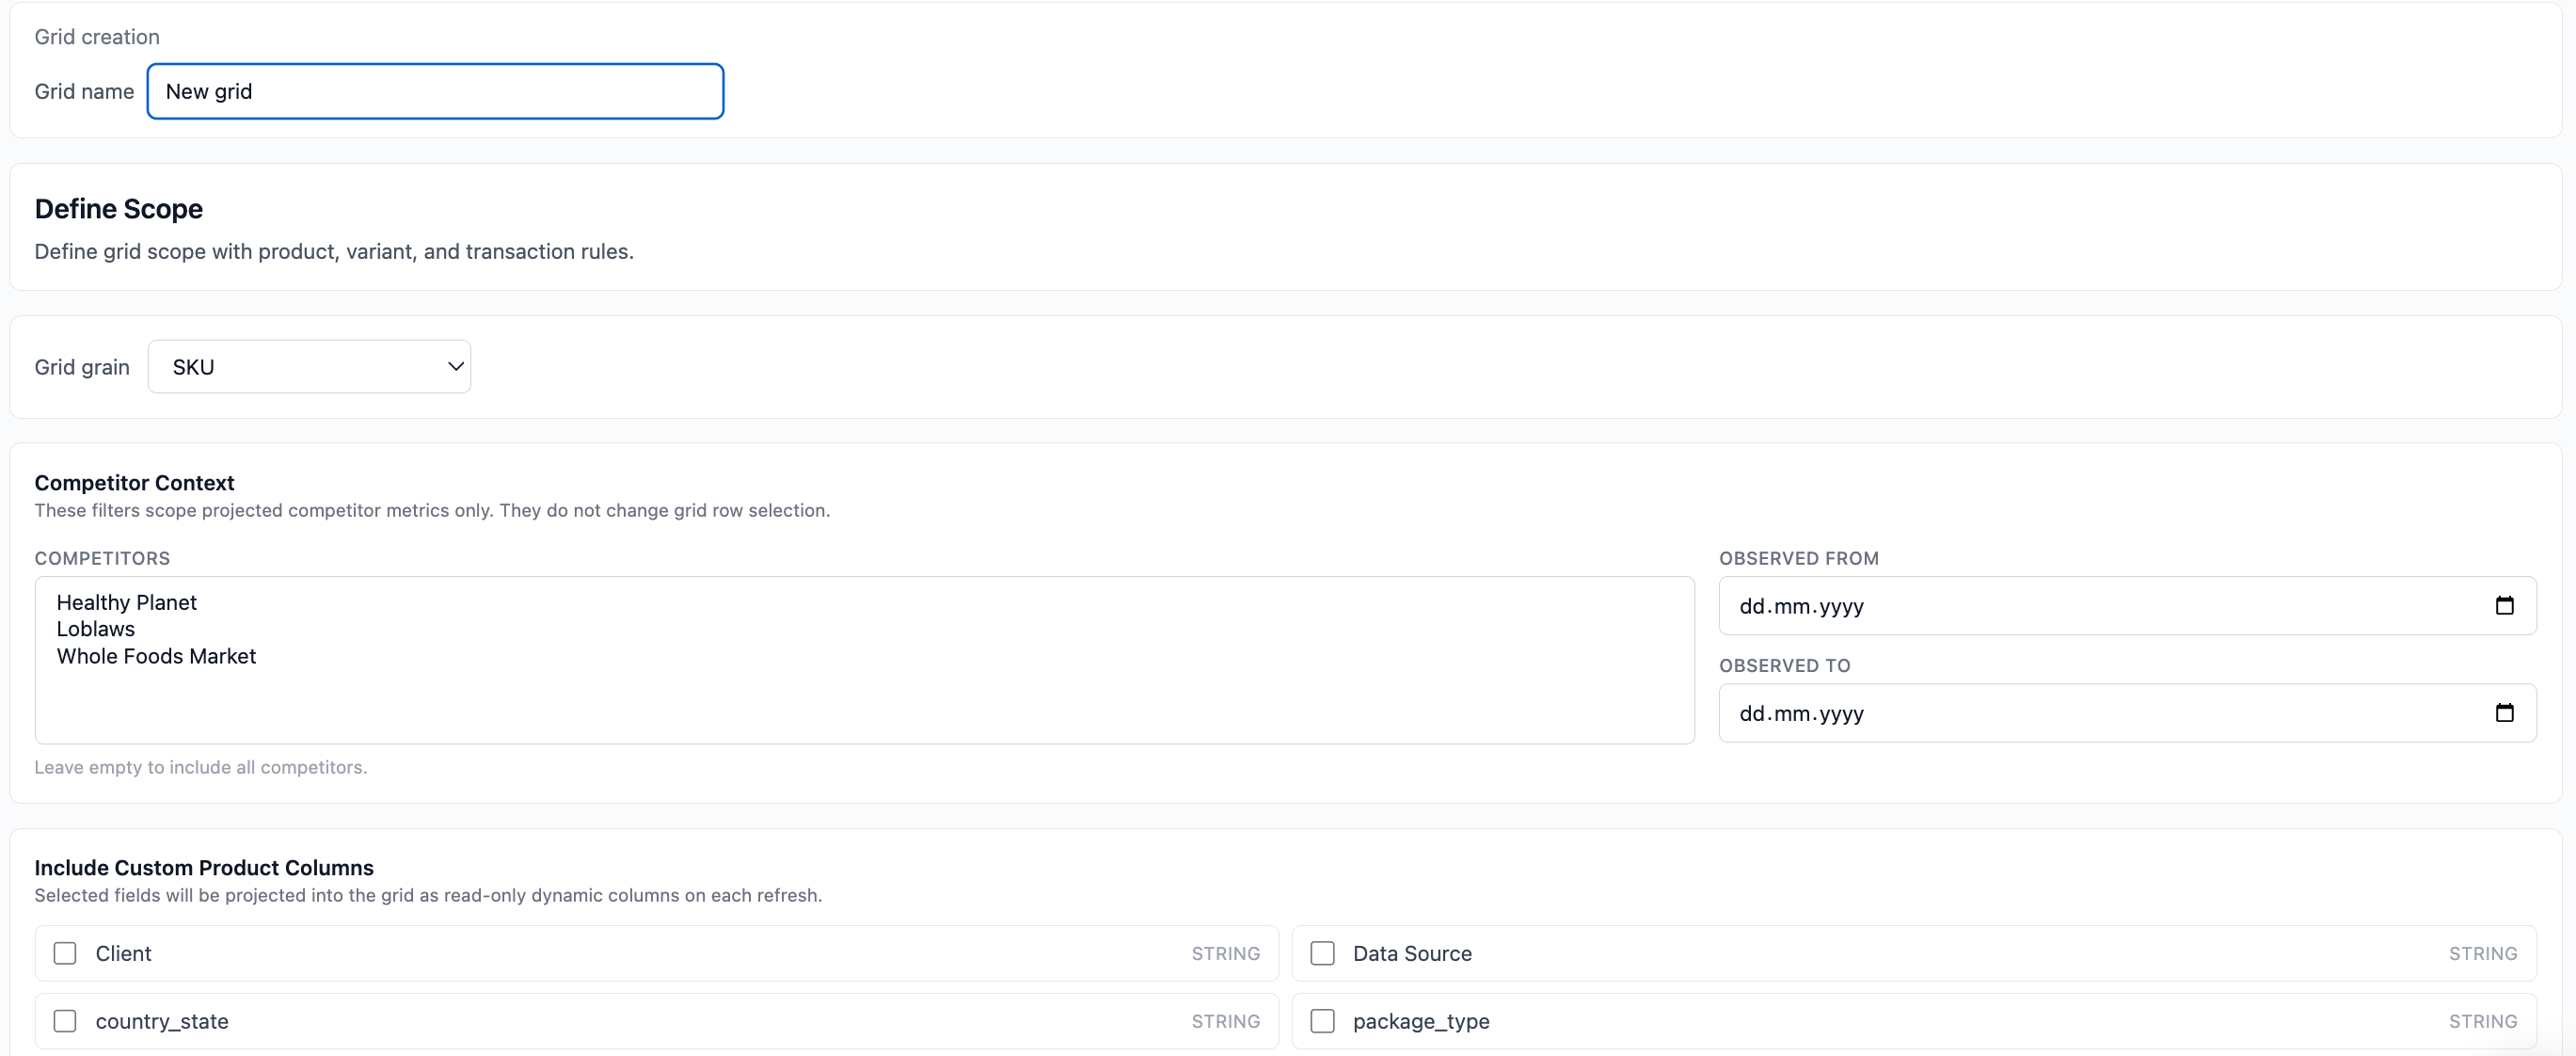
At the top:- Enter a clear, descriptive name
Example:ArlaDairy – Margin OptimizationMarch Price Test
Name your grid
Step 3. Define your scope
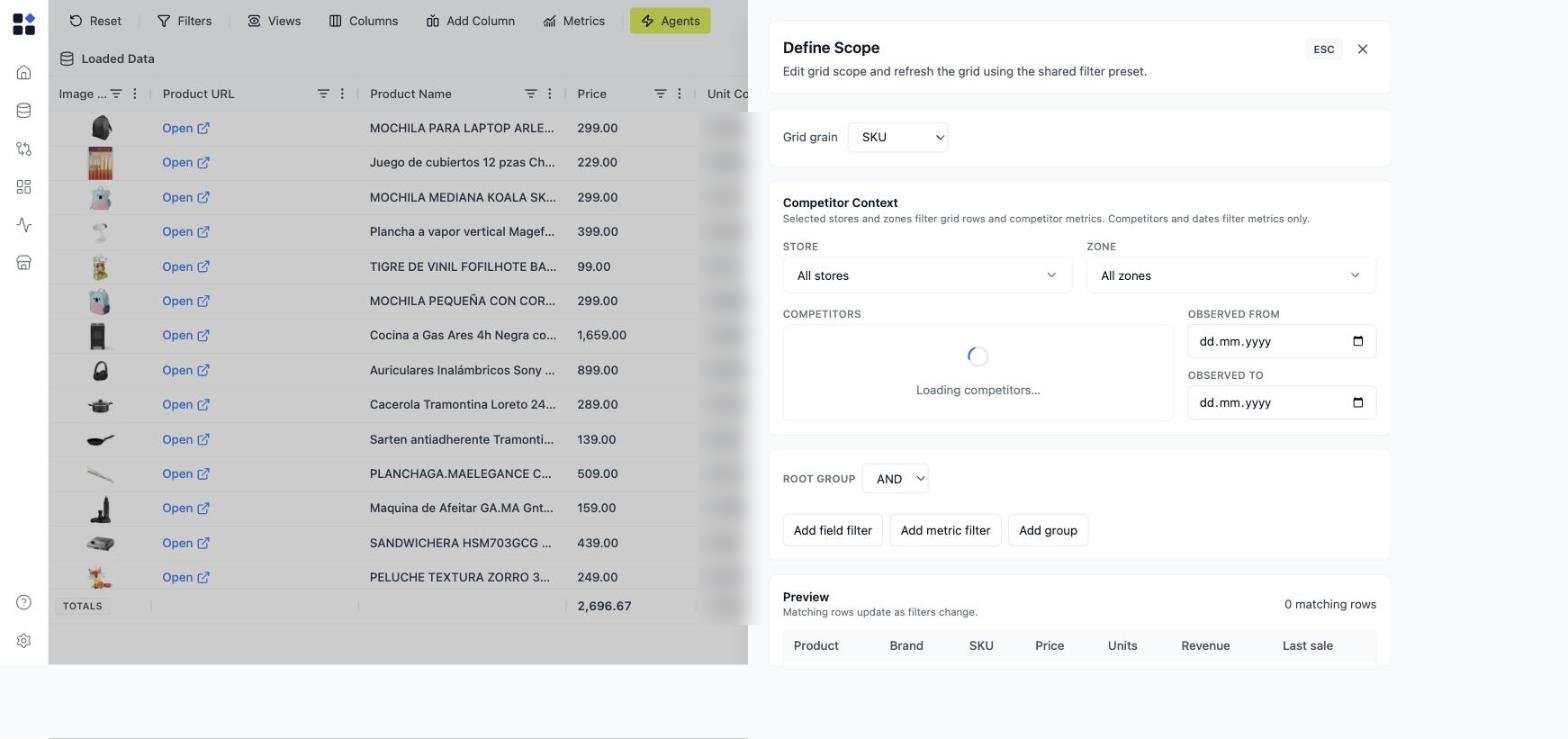
The scope panel is where you narrow your catalog down to the products this grid should hold. It’s organized so the controls you reach for most stay in front of you, and the rest stay out of the way until you need them. Open by default:- Grid grain — whether a row is one product or one product-store combination. See Product and SKU-Store grid views.
- Search — find products by name or ID.
- Quick filters — three one-click toggles: Status = Active, Stock > 0, and Sales > 0 (in the last 52 weeks).
- Category and Brand — each shows the top values with a “+N more” search box, so an account with hundreds of categories or brands stays usable instead of listing everything at once.
- Location — narrow to specific stores or zones.
- Competitor context — choose the competitors and the observation window the market-data metrics use (see below).
- Custom columns — add columns to the grid as you build it.
- Advanced filters — build precise row sets with Add field filter (on a product attribute) and Add metric filter (on a computed metric such as margin or sales), combined into nested
AND/ORgroups with Add group.
Define scope
Step 4. Select products
With your filters set, choose the products the grid will hold:- Select individual SKUs
- Select all filtered results
- Clear selection
Step 5. Click “Create grid”
The pinned header keeps the title, Cancel, and Create grid in view the whole time, so you never scroll to find the button. When your scope looks right:- Click Create grid
- Retailgrid creates your grid and opens it
Step 6. Start working in your grid
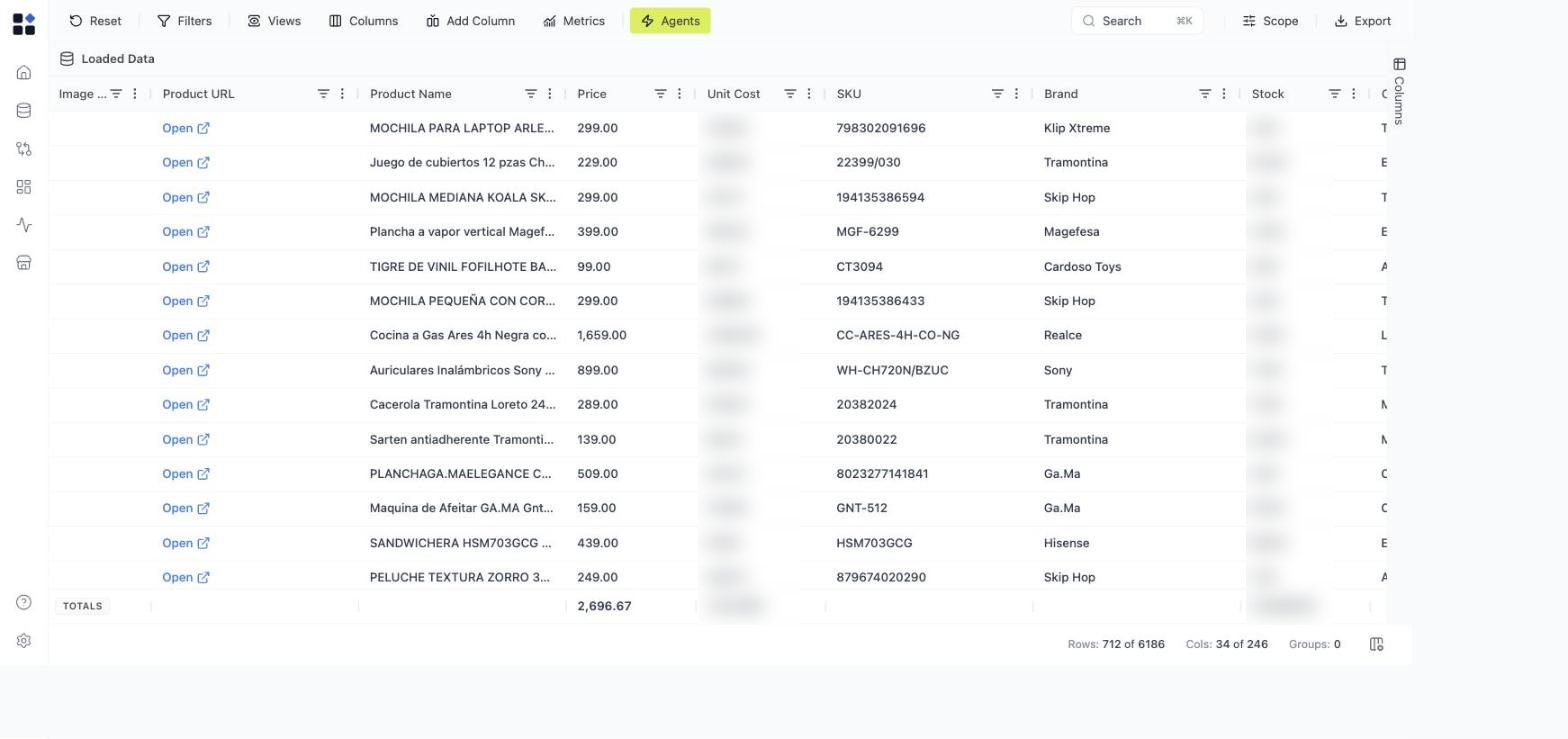
Your new grid opens in spreadsheet-style grid format. From here you can:Analyze
- Sort and filter
- Compare price vs cost
- Review margin gaps
Modify
- Edit prices directly
- Add calculated columns
- Apply bulk updates
Execute
- Use Agents
- Run pricing rules
- Export data
- Prepare price updates
Grid is ready
Change which products are in the grid
The selection you made when creating the grid isn’t permanent. Click Scope in the top-right of the grid toolbar to reopen the grid’s definition and change it. The scope panel holds more than the product selection:- Grid grain - whether a row is one product or one product-store combination. See Product and SKU-Store grid views.
- Competitor context - Store and Zone narrow both the grid’s rows and its competitor metrics. Competitors and the competitor observation window narrow the metrics only, so you can ask “how did we sit against these two competitors” without changing which products are in the grid. The observation window is a rolling lookback — Last 7, Last 14, Last 30, or a custom number of days — re-evaluated against the current date every time the grid is filled or refreshed. A grid set to “Last 14 days” keeps showing only competitor prices observed in the last 14 days, and stays that way on later refreshes without editing the scope. Competitor-derived metrics (index, min/max, coverage) reflect the same windowed set as the visible prices. Grids created before this change keep their fixed Observed from / Observed to dates until you next edit the scope.
- Filters - build the row set with Add field filter (on a product attribute) and Add metric filter (on a computed metric such as margin or sales). Combine them into nested groups with Add group, and set each group to
ANDorOR. - Preview - the matching row count and a sample of the rows, updating as you change the filters. Check it before you apply: a filter combination that returns zero rows is easier to spot here than in an empty grid.
How your grid stays fresh
Every grid is refreshed automatically overnight with the latest data from your datasets. You don’t need to trigger a manual refresh after replacing a file — the next night’s run picks it up.- Nightly refresh — runs once per day during an off-hours window and covers every active grid.
- On-demand updates — replace a dataset on the Datasets page at any time; the change becomes visible in your grids on the next nightly refresh, or sooner if you manually run an agent against the grid.
- Per-grid status — failed refreshes are visible in the Runs section, where
system-triggered nightly jobs appear alongside user-triggered runs.