

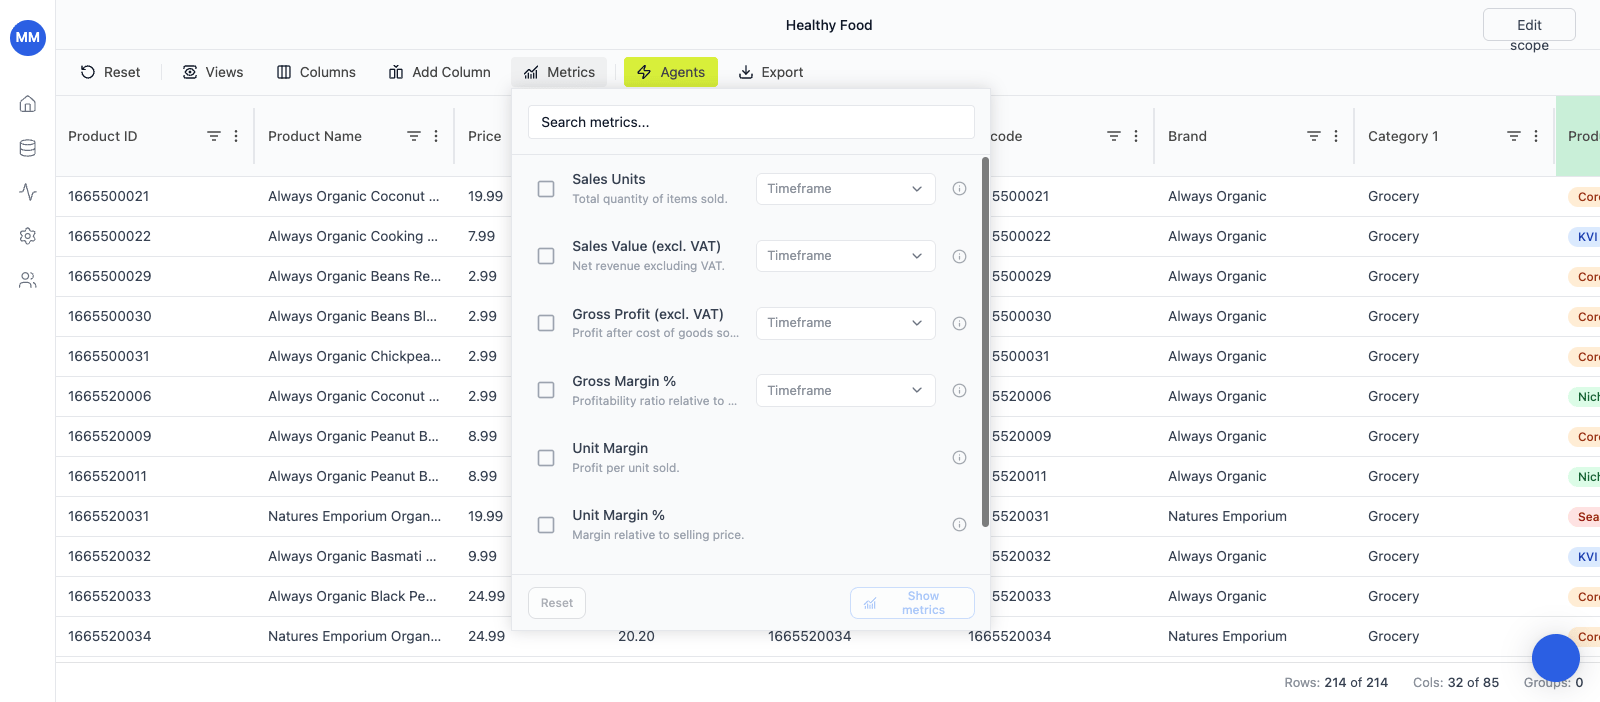
Open the Metrics picker
In any grid:- Click Metrics in the top toolbar (between Add Column and Agents).
- The Metrics side picker opens with the full metrics library.
- Search by name, tick the metrics you want, set a timeframe per metric.
- Click Show metrics at the bottom of the picker.
Sales Units (7D), Gross Margin % (30D), and so on.
Available metrics
| Metric | What it means |
|---|---|
| Sales Units | Total quantity of items sold in the timeframe. |
| Sales Value (excl. VAT) | Net revenue excluding VAT in the timeframe. |
| Gross Profit (excl. VAT) | Profit after cost of goods sold, excluding VAT. |
| Gross Margin % | Profitability ratio relative to sales value. |
| Unit Margin | Profit per unit sold. |
| Unit Margin % | Margin relative to selling price. |
Timeframes
Each metric can be added in any of these timeframes:- 7D — trailing 7 days.
- 30D — trailing 30 days.
- 90D — trailing 90 days.
- 180D — trailing 180 days.
Sales Units (7D) and Sales Units (30D) side by side — to compare short-term and longer-term behavior.
Metrics are computed off your loaded Transactions data. If a product has no transactions in the chosen window, the cell is blank rather than zero.
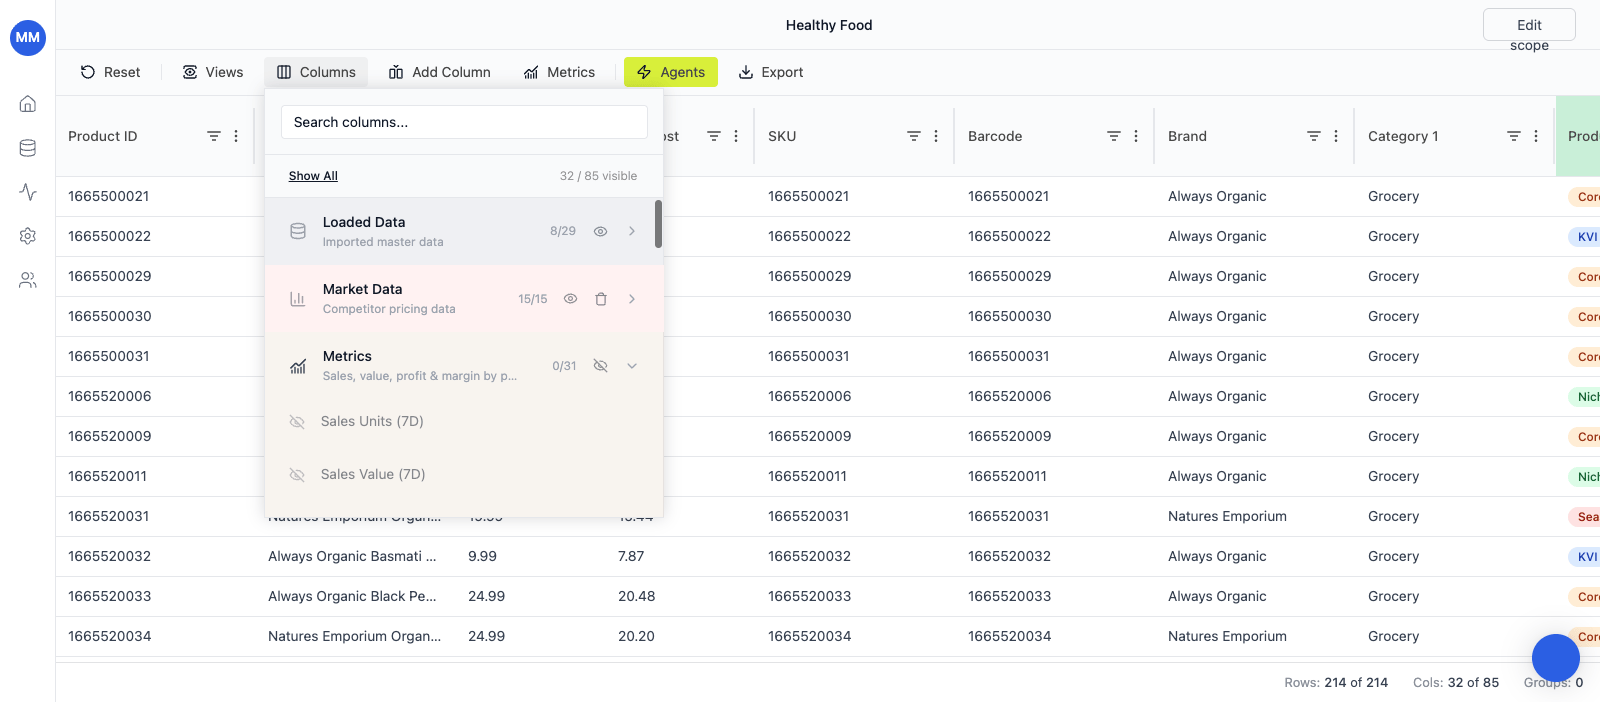
Show, hide, and remove metric columns
Once added, metric columns behave like any other column in the Columns panel:- Open Columns in the toolbar.
- Expand the Metrics group — it lists every metric-timeframe combination you’ve ever shown on this grid (
0/31 visibleby default if you haven’t added any yet). - Click the eye icon next to any metric to show or hide it.
- Hide All on the group collapses the whole panel without losing the metric definitions.
Metrics vs Add Column → Analytical metric
Metrics and the Analytical metric option in Add Column draw from the same curated KPI library. They differ in entry point and ergonomics:- Metrics (top toolbar) — a side picker built for adding several KPIs at once, each with its own timeframe, in a single confirm step. Recommended for setting up a new grid for analysis.
- Add Column → Analytical metric — the single-metric flow inside the column creation dialog. Useful when you’re already in the Add Column flow and want to drop in one more metric without leaving it.
When to use Metrics vs Formula columns
Use Metrics when:- The KPI you want is in the curated library (sales, value, profit, margin).
- You want a value per timeframe and you want it to stay current automatically.
- You’re doing portfolio or category analysis and need consistent definitions across grids.
- You want a custom calculation that combines specific columns in your grid (e.g.
{Price} - {Competitor Price}). - You need an
IF/ classification expression that isn’t a standard retail KPI. - You’re computing something that only makes sense in the context of this particular grid.
Sales Units (30D), then write a formula column on top of it (e.g. revenue concentration, share of sales).
Common pitfalls
- Blank metric cells — the product has no transactions in the chosen window. Either widen the timeframe or accept the gap (it’s signal, not a bug).
- No metrics in the picker — your account has no transactional data loaded yet. Upload Transactions on the Datasets page or via the API.
- Metric definitions don’t match your finance reporting — Retailgrid’s curated definitions are intentionally conservative (Gross Margin %, Sales Value excl. VAT, etc.). If your team uses a different convention, model it with a Formula column rather than reinterpreting the metric value.