> ## Documentation Index
> Fetch the complete documentation index at: https://docs.retailgrid.io/llms.txt
> Use this file to discover all available pages before exploring further.
# Configure grid
> Customize your grid layout by choosing visible columns, sorting, grouping, pinning, filtering, and saving views.
Once your **Grid** is created, you can configure the grid to match your pricing workflow.
Retailgrid gives you full control over:
* Visible columns
* Column order
* Pinned columns
* Sorting
* Grouping
* Saved views
Below is how to configure your grid efficiently.
Your grid layout — visible columns, order, sorting, grouping, and filters — **autosaves as you work**, with a confirmation in the status line at the top of the grid. There's no "Leave site? Changes you made may not be saved" prompt to worry about. **Views** (see step 7) are for naming and switching between distinct saved layouts, not for avoiding lost work.
## Search the grid
Use the grid **search** box to find a product by *any* attribute — SKU, name, brand, EAN, supplier, category, or any custom field — without building a filter. Type a value and the grid narrows to matching rows instantly. Clear the search to return to the full set.
## 1. Select visible columns
You can show or hide any column.
### How to do it
1. Click **Columns** in the top toolbar
2. Use the search field to find a column
3. Click the eye icon to:
* Show column
* Hide column
4. You can also use **Hide All** if you want to rebuild the layout from scratch
The Columns panel groups related columns into expandable sections, supports search, expand/collapse, and bulk show/hide for faster navigation in large grids.
### Column type icons
Each column header shows a small icon indicating its type:
* **Editable** — manually entered values you can change row by row.
* **Formula** — calculated from other columns; values update automatically.
* **AI-generated** — populated by a Retailgrid AI action (e.g. enrichment, classification).
### Best practice
Keep only what you need for the task.\
Example for pricing work:
* Product Name
* Price
* Unit Cost
* Margin
* Competitor Price
* Status
## Visible columns
 ## 2. Order columns by drag and drop
You can rearrange columns freely.
### How to do it
* Click and hold a column header
* Drag it left or right
* Drop it where you want it
### Recommended layout
Left (fixed reference):
* Product Name
* Product ID
Middle (analysis):
* Price
* Unit Cost
* Margin
* Elasticity
Right (attributes):
* Brand
* Category
* Manufacturer
Organize based on your workflow.
## 3. Pin columns
Pinning keeps important columns visible while scrolling.
### How to pin
1. Click the three-dot menu on a column header
2. Select **Pin Column**
3. Choose:
* Pin Left
* Pin Right
### When to use
Pin Left:
* Product Name
* SKU
Pin Right:
* Status
* Actions
Pinning is essential when working with many pricing metrics.
## Pin column
## 2. Order columns by drag and drop
You can rearrange columns freely.
### How to do it
* Click and hold a column header
* Drag it left or right
* Drop it where you want it
### Recommended layout
Left (fixed reference):
* Product Name
* Product ID
Middle (analysis):
* Price
* Unit Cost
* Margin
* Elasticity
Right (attributes):
* Brand
* Category
* Manufacturer
Organize based on your workflow.
## 3. Pin columns
Pinning keeps important columns visible while scrolling.
### How to pin
1. Click the three-dot menu on a column header
2. Select **Pin Column**
3. Choose:
* Pin Left
* Pin Right
### When to use
Pin Left:
* Product Name
* SKU
Pin Right:
* Status
* Actions
Pinning is essential when working with many pricing metrics.
## Pin column
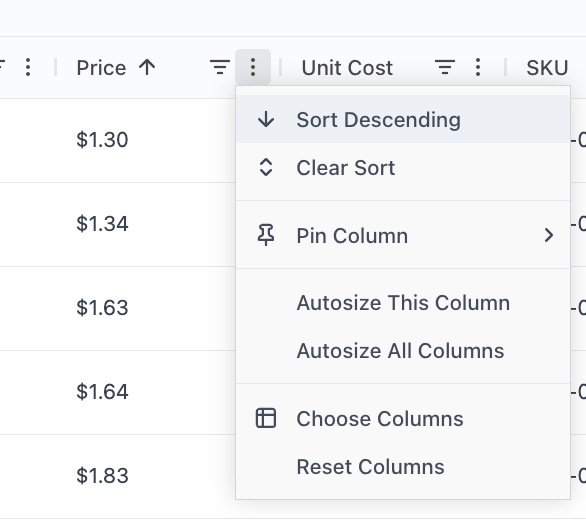 ## 4. Sort values
You can sort any column.
### How to sort
* Click column header to toggle ascending / descending\
OR
* Use the column menu → Sort Ascending / Descending
### Example use cases
* Sort by **Price Descending** → find premium items
* Sort by **Unit Cost Descending** → detect cost risk
* Sort by **Margin Ascending** → identify weak SKUs
You can also **Clear Sort** from the column menu.
The image column is sortable and filterable like any other column; products without an image show a placeholder so missing imagery is easy to spot.
## Sorting
## 4. Sort values
You can sort any column.
### How to sort
* Click column header to toggle ascending / descending\
OR
* Use the column menu → Sort Ascending / Descending
### Example use cases
* Sort by **Price Descending** → find premium items
* Sort by **Unit Cost Descending** → detect cost risk
* Sort by **Margin Ascending** → identify weak SKUs
You can also **Clear Sort** from the column menu.
The image column is sortable and filterable like any other column; products without an image show a placeholder so missing imagery is easy to spot.
## Sorting
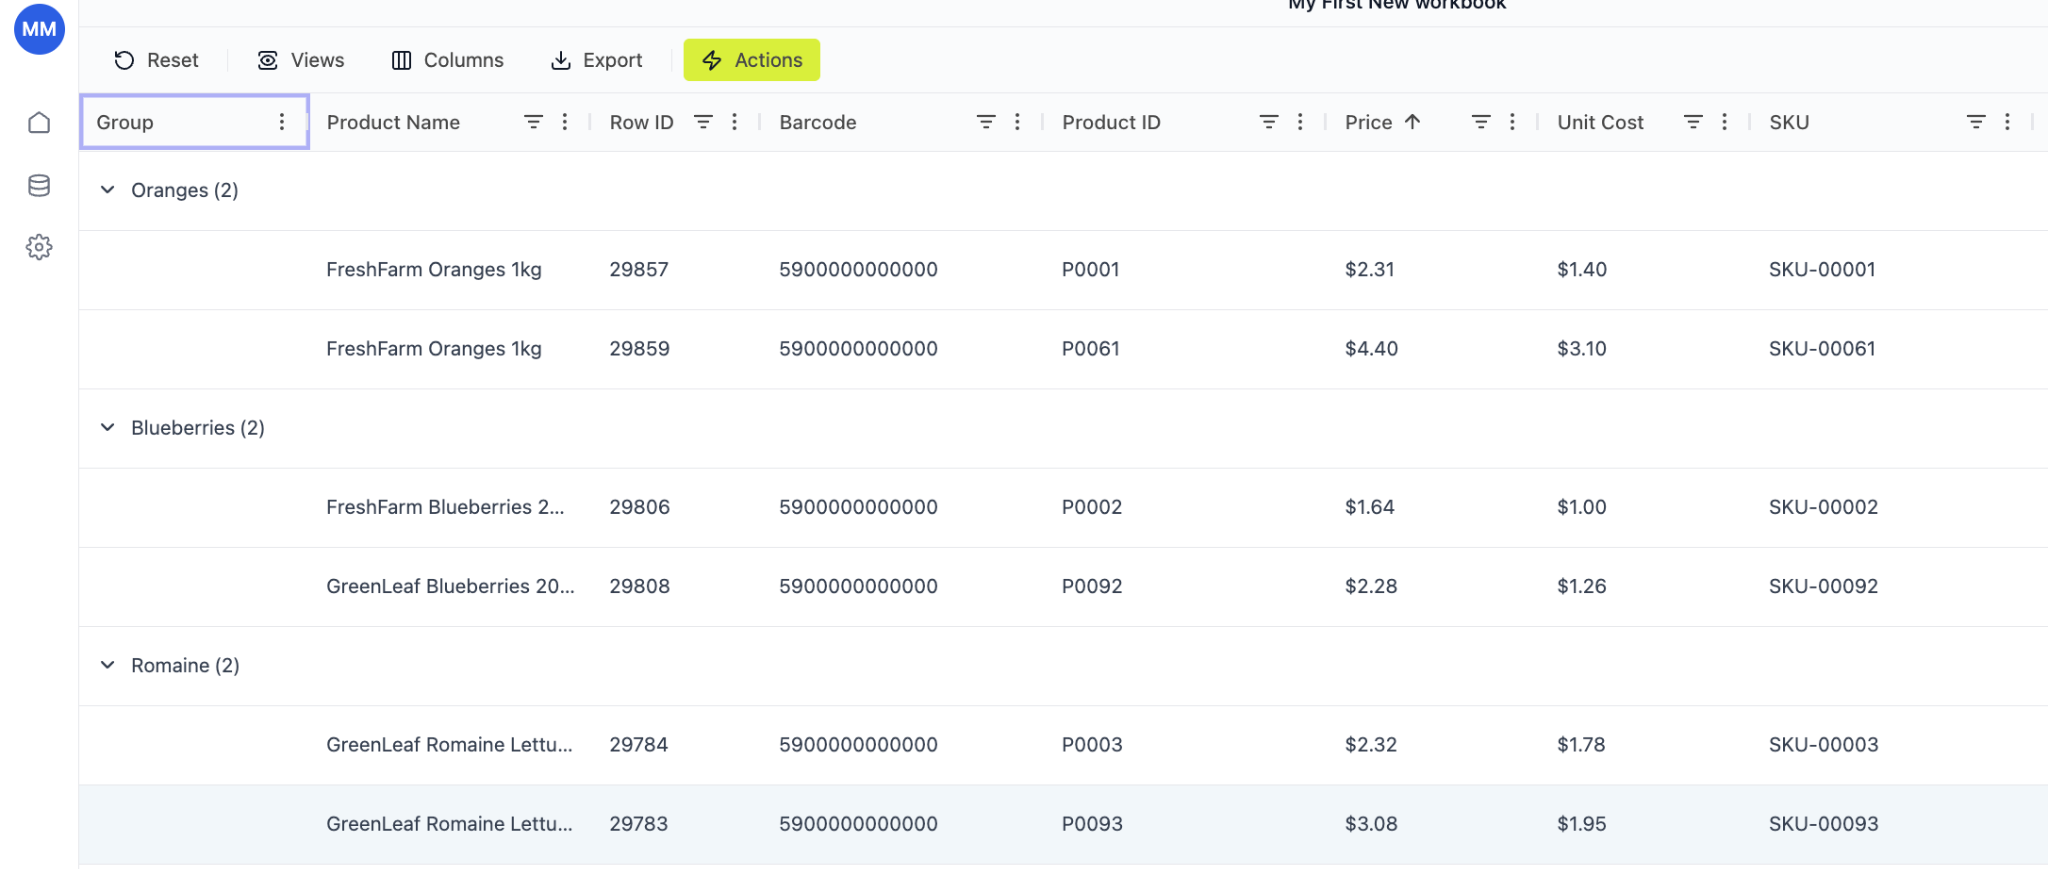
 ## 5. Group products
Grouping lets you analyze structured segments.
### How to group
1. Drag a column into the grouping area (if enabled)\
OR
2. Use the Group column (if preconfigured)
Example groupings:
* Group by Product Group
* Group by Brand
* Group by Category
You'll see collapsible sections:
* Oranges (2)
* Blueberries (2)
* Romaine (2)
### Why grouping matters
* Compare pricing inside category
* Spot inconsistencies
* Review margin distribution by group
Grouping turns a flat list into a structured analysis tool.
### Value aggregation per column
When grouping is active, each numeric column rolls up to a single value per group. Retailgrid picks a sensible default based on the column's semantic type — **Sales** sums, **Price** and **Margin** average, **Product ID** counts. Aggregation runs on the backend so the rolled-up values stay correct and consistent across any grid size.
To override the default, open the column header's three-dot menu → **Value Aggregation** and pick from `None`, `Sum`, `Average`, `Min`, `Max`, `Count`. Your override is per-column and persists with the grid view.
## Group
## 5. Group products
Grouping lets you analyze structured segments.
### How to group
1. Drag a column into the grouping area (if enabled)\
OR
2. Use the Group column (if preconfigured)
Example groupings:
* Group by Product Group
* Group by Brand
* Group by Category
You'll see collapsible sections:
* Oranges (2)
* Blueberries (2)
* Romaine (2)
### Why grouping matters
* Compare pricing inside category
* Spot inconsistencies
* Review margin distribution by group
Grouping turns a flat list into a structured analysis tool.
### Value aggregation per column
When grouping is active, each numeric column rolls up to a single value per group. Retailgrid picks a sensible default based on the column's semantic type — **Sales** sums, **Price** and **Margin** average, **Product ID** counts. Aggregation runs on the backend so the rolled-up values stay correct and consistent across any grid size.
To override the default, open the column header's three-dot menu → **Value Aggregation** and pick from `None`, `Sum`, `Average`, `Min`, `Max`, `Count`. Your override is per-column and persists with the grid view.
## Group
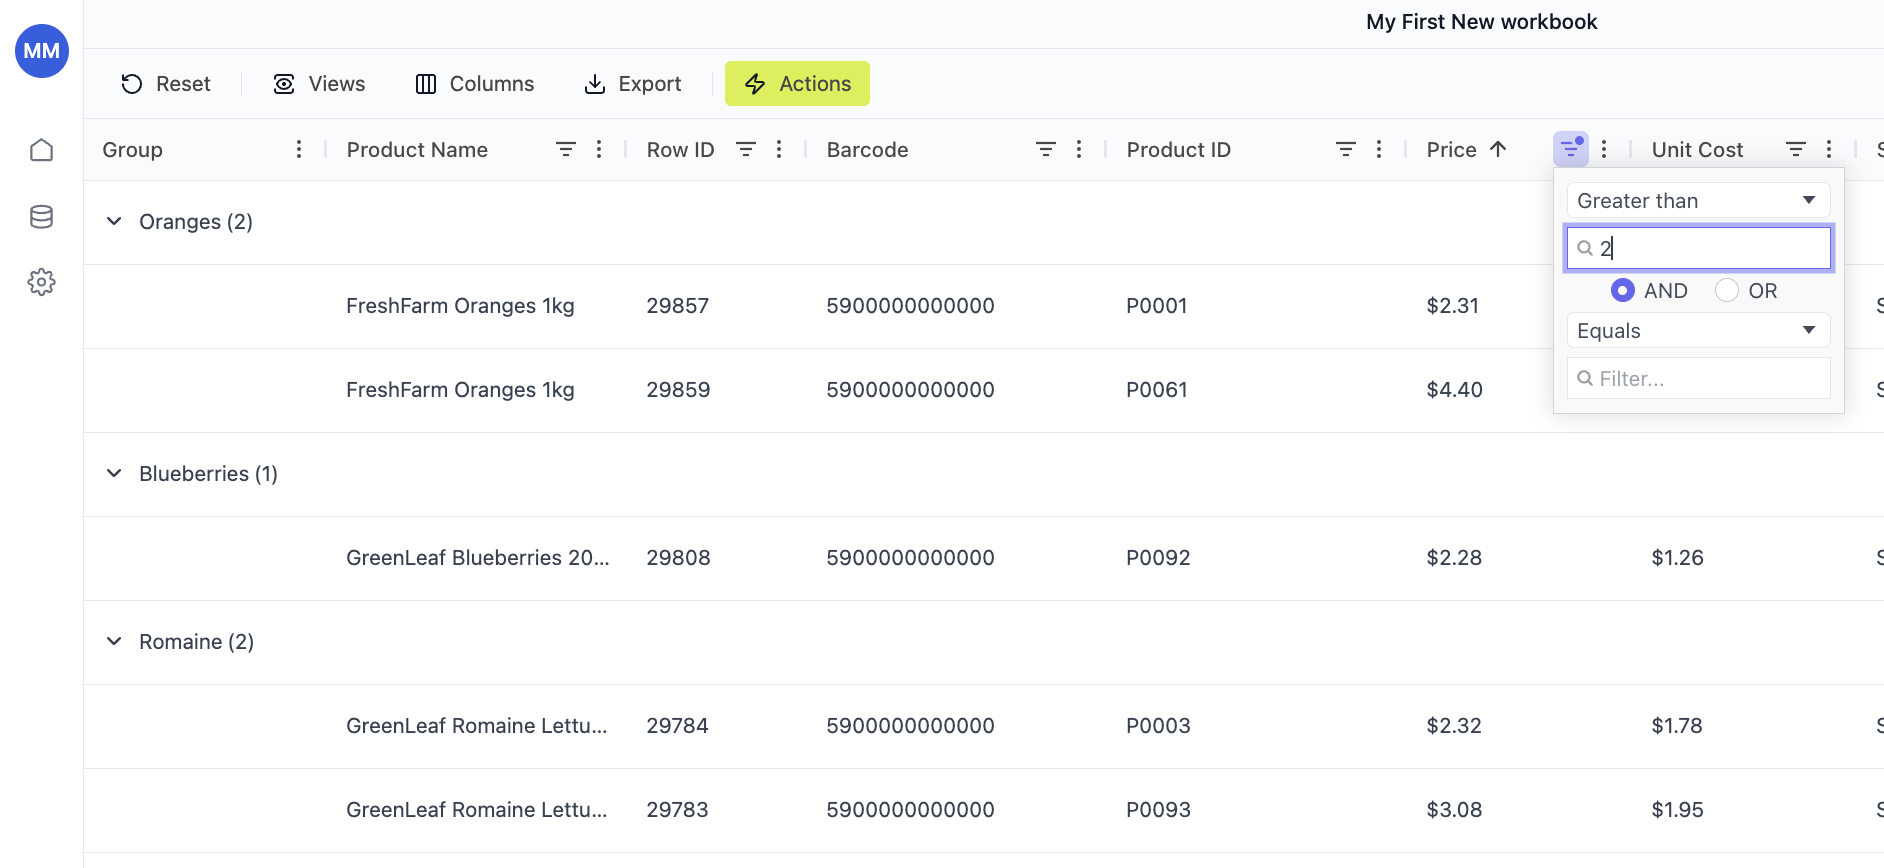
 ## 6. Filter columns
Filtering allows you to narrow down products based on specific criteria — instantly focusing on what matters.
You can filter any column (numeric, text, status, etc.).
### How to apply a filter
1. Click the **filter icon** in the column header
2. Choose a condition from the dropdown
3. Enter your filter value
4. The grid updates immediately
### Numeric filters (price, cost, margin, etc.)
For numeric columns, you can use:
* Greater than
* Less than
* Equals
* Not equal
* Between
### Example
* Price **Greater than 2**
* Unit Cost **Less than 3**
* Margin **Below 20%**
You can also combine conditions using:
* **AND**
* **OR**
Example:
* Price > 2 **AND** Price \< 5
This helps you isolate specific price corridors.
### Text filters (brand, product name, SKU, etc.)
For text columns, you can filter by:
* Contains
* Equals
* Starts with
* Ends with
### Example
* Brand equals *Arla*
* Product Name contains *Greek*
## Filtering
## 6. Filter columns
Filtering allows you to narrow down products based on specific criteria — instantly focusing on what matters.
You can filter any column (numeric, text, status, etc.).
### How to apply a filter
1. Click the **filter icon** in the column header
2. Choose a condition from the dropdown
3. Enter your filter value
4. The grid updates immediately
### Numeric filters (price, cost, margin, etc.)
For numeric columns, you can use:
* Greater than
* Less than
* Equals
* Not equal
* Between
### Example
* Price **Greater than 2**
* Unit Cost **Less than 3**
* Margin **Below 20%**
You can also combine conditions using:
* **AND**
* **OR**
Example:
* Price > 2 **AND** Price \< 5
This helps you isolate specific price corridors.
### Text filters (brand, product name, SKU, etc.)
For text columns, you can filter by:
* Contains
* Equals
* Starts with
* Ends with
### Example
* Brand equals *Arla*
* Product Name contains *Greek*
## Filtering
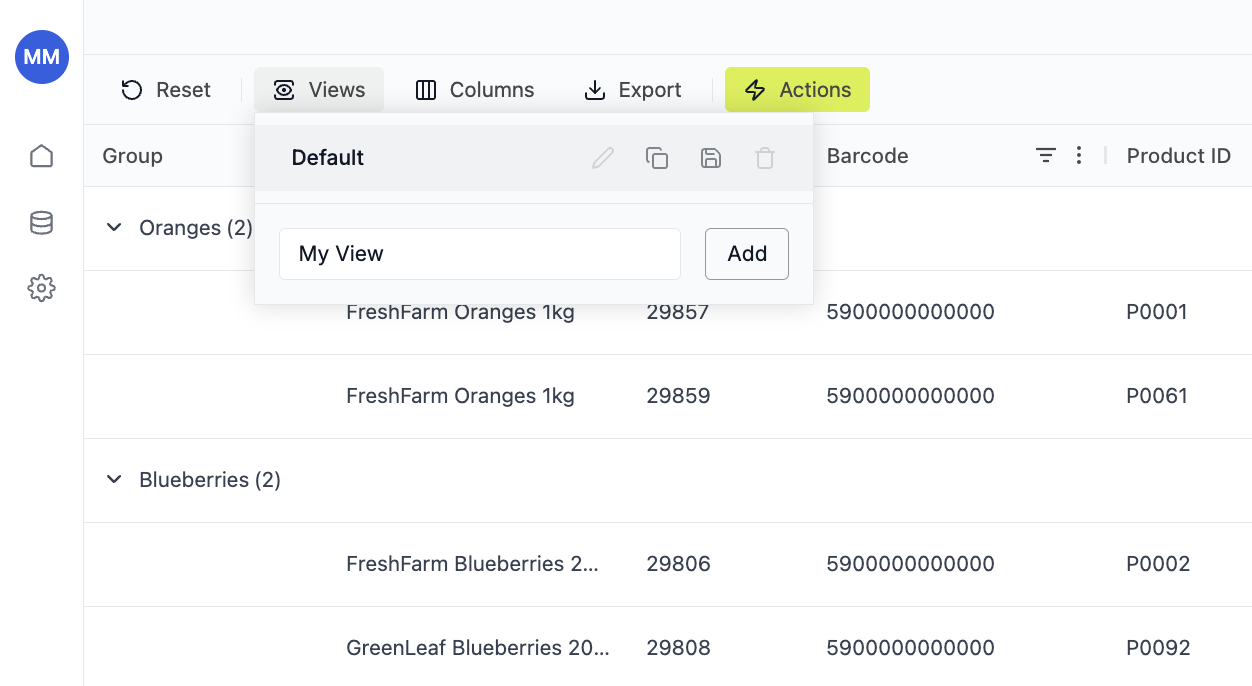
 ## 7. Save view as default or create your own view
Once your layout is configured, save it as a named view to switch back to later. (Your working layout already autosaves — named views are for keeping several distinct setups side by side.)
### How to save
1. Click **Views** in the toolbar
2. Enter a name (e.g., "Margin Analysis")
3. Click **Add**
You can:
* Keep Default view
* Create multiple custom views
* Switch between them instantly
### Example saved views
| View Name | Purpose |
| :--------------- | :--------------------------- |
| Margin Review | Price, Cost, Margin columns |
| Competitive View | Price, Competitor Price, CPI |
| Operations | SKU, Barcode, Status |
| Elasticity | Elasticity, Revenue, Price Δ |
Saved views allow different teams (pricing, category, operations) to work in the same grid with different layouts.
## 7. Save view as default or create your own view
Once your layout is configured, save it as a named view to switch back to later. (Your working layout already autosaves — named views are for keeping several distinct setups side by side.)
### How to save
1. Click **Views** in the toolbar
2. Enter a name (e.g., "Margin Analysis")
3. Click **Add**
You can:
* Keep Default view
* Create multiple custom views
* Switch between them instantly
### Example saved views
| View Name | Purpose |
| :--------------- | :--------------------------- |
| Margin Review | Price, Cost, Margin columns |
| Competitive View | Price, Competitor Price, CPI |
| Operations | SKU, Barcode, Status |
| Elasticity | Elasticity, Revenue, Price Δ |
Saved views allow different teams (pricing, category, operations) to work in the same grid with different layouts.
 ## Reset layout
If needed, click **Reset** to restore the default configuration.
## Reset layout
If needed, click **Reset** to restore the default configuration.