> ## Documentation Index
> Fetch the complete documentation index at: https://docs.retailgrid.io/llms.txt
> Use this file to discover all available pages before exploring further.
# Dashboards overview
> Pre-built and AI-generated analytical views over your Retailgrid data - pricing, competitor pressure, margin health - all in one place.
**Dashboards** turn the data already in your grids into ready-to-read analytical views. Open **Dashboards** from the left sidebar to see the built-in dashboards Retailgrid ships with, plus any dashboard you or a teammate has created.
Dashboards read from the same underlying [datasets](/data-requirements/datasets) your grids read from - no separate data load is needed. Refresh a dataset and every dashboard built on it follows.
## The Dashboards home page
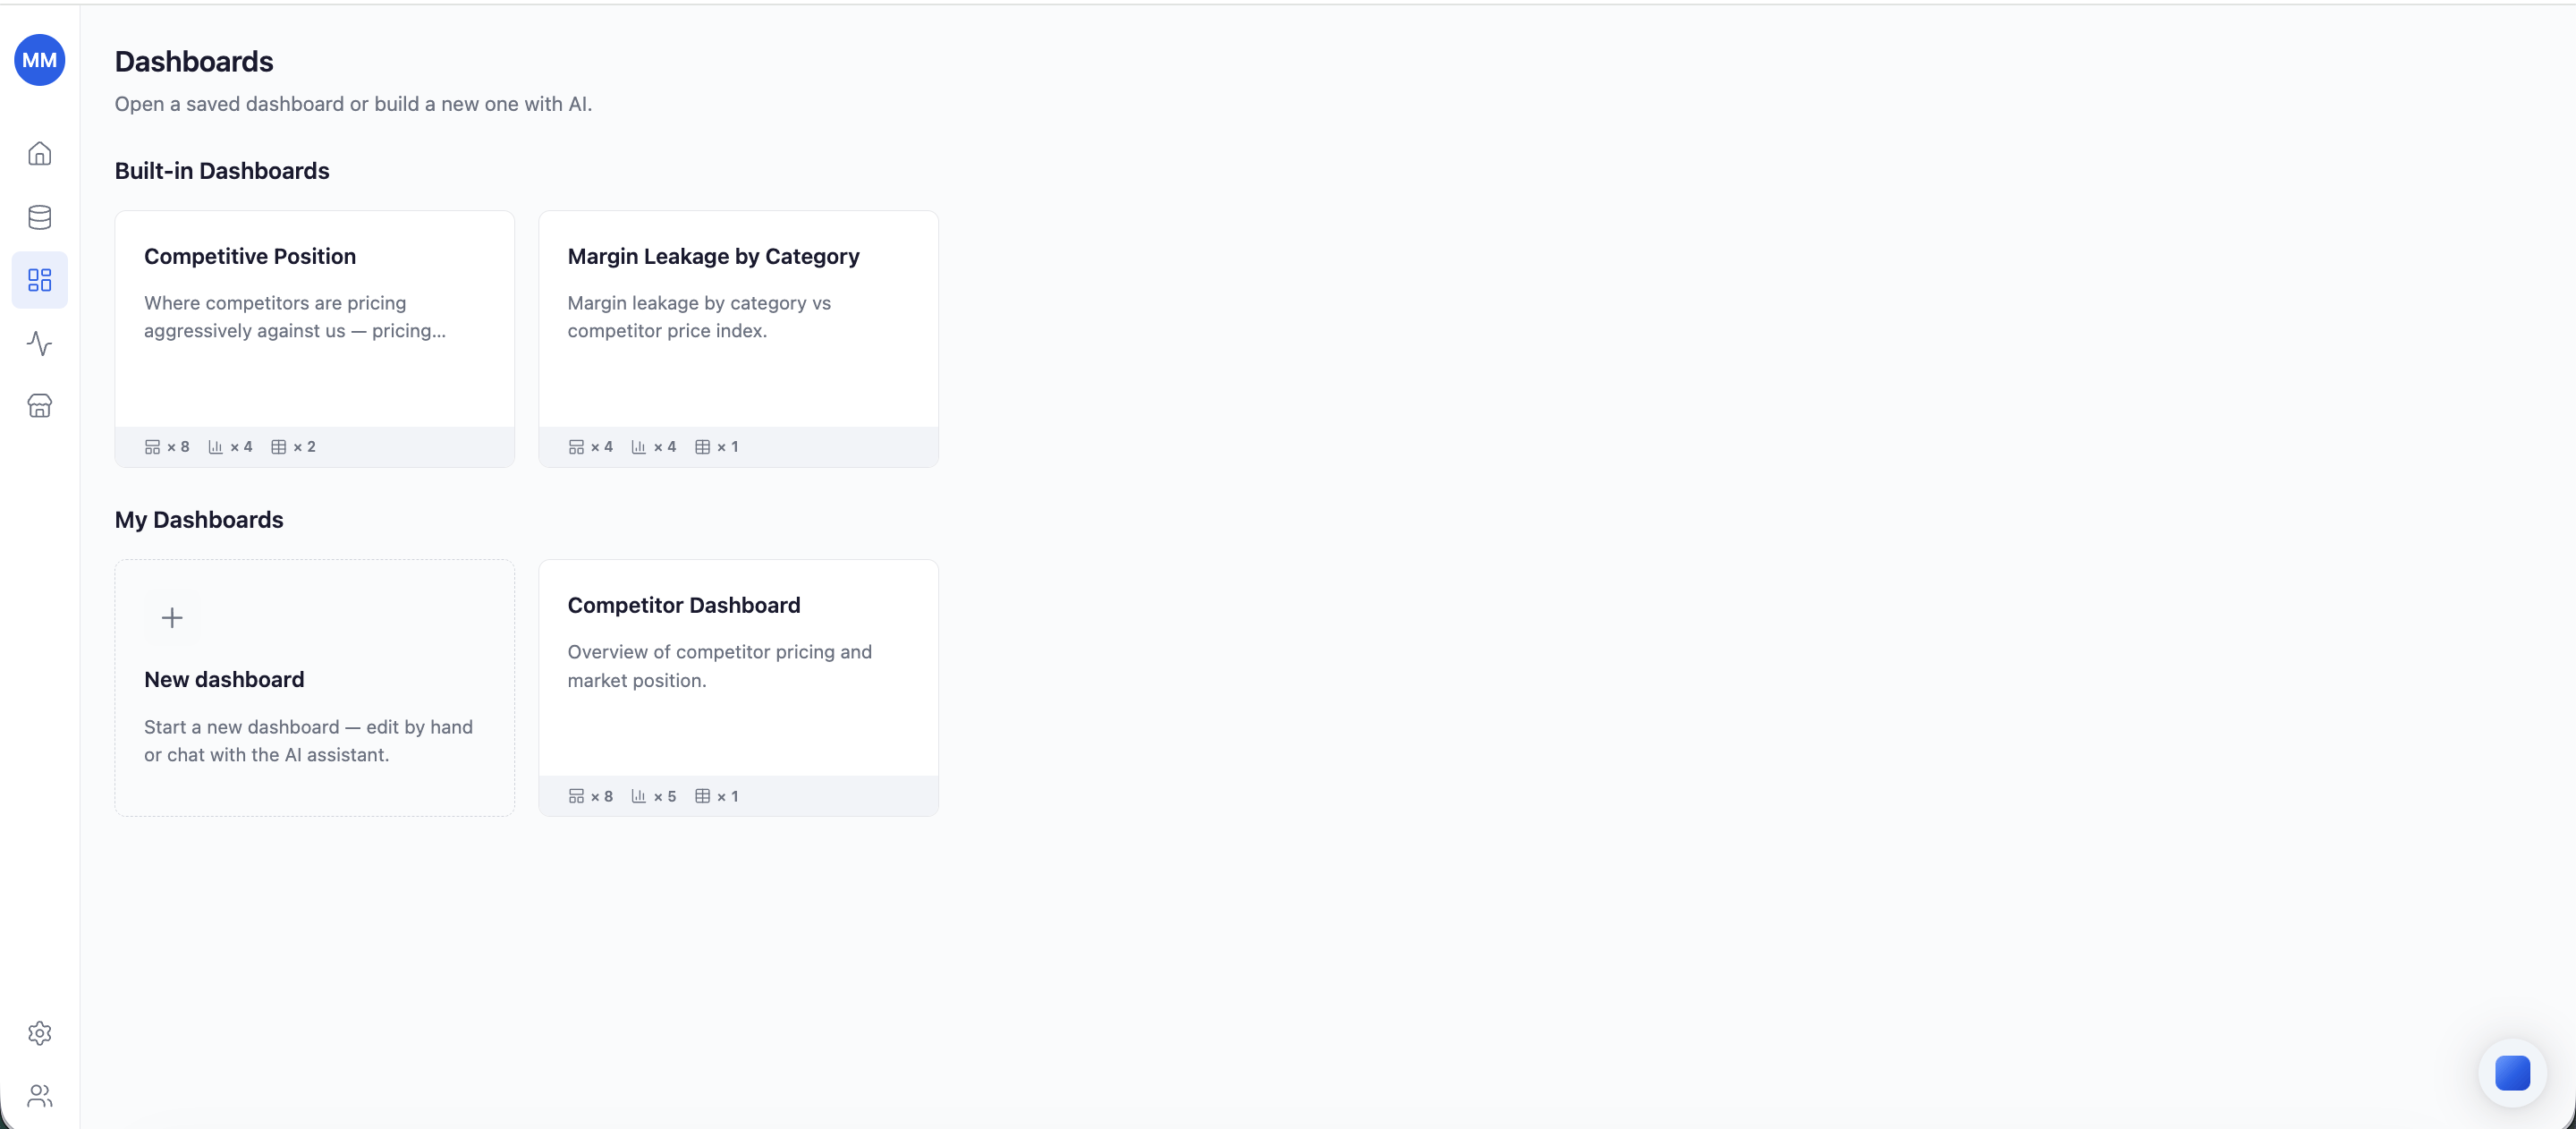
The Dashboards page lists every dashboard in one place - **Built-in Dashboards** and **My Dashboards**. From here you can:
* **Open** any dashboard in place. Every chart is interactive - hover for the data point, click a legend entry to isolate it.
* **Create** a new dashboard from the **New dashboard** tile - build it by hand or chat with the AI assistant in the [dashboard editor](/dashboards/editor).
* **Rename** or **delete** a dashboard you created.
 ## Built-in dashboards
Retailgrid ships analyst-grade dashboards out of the box:
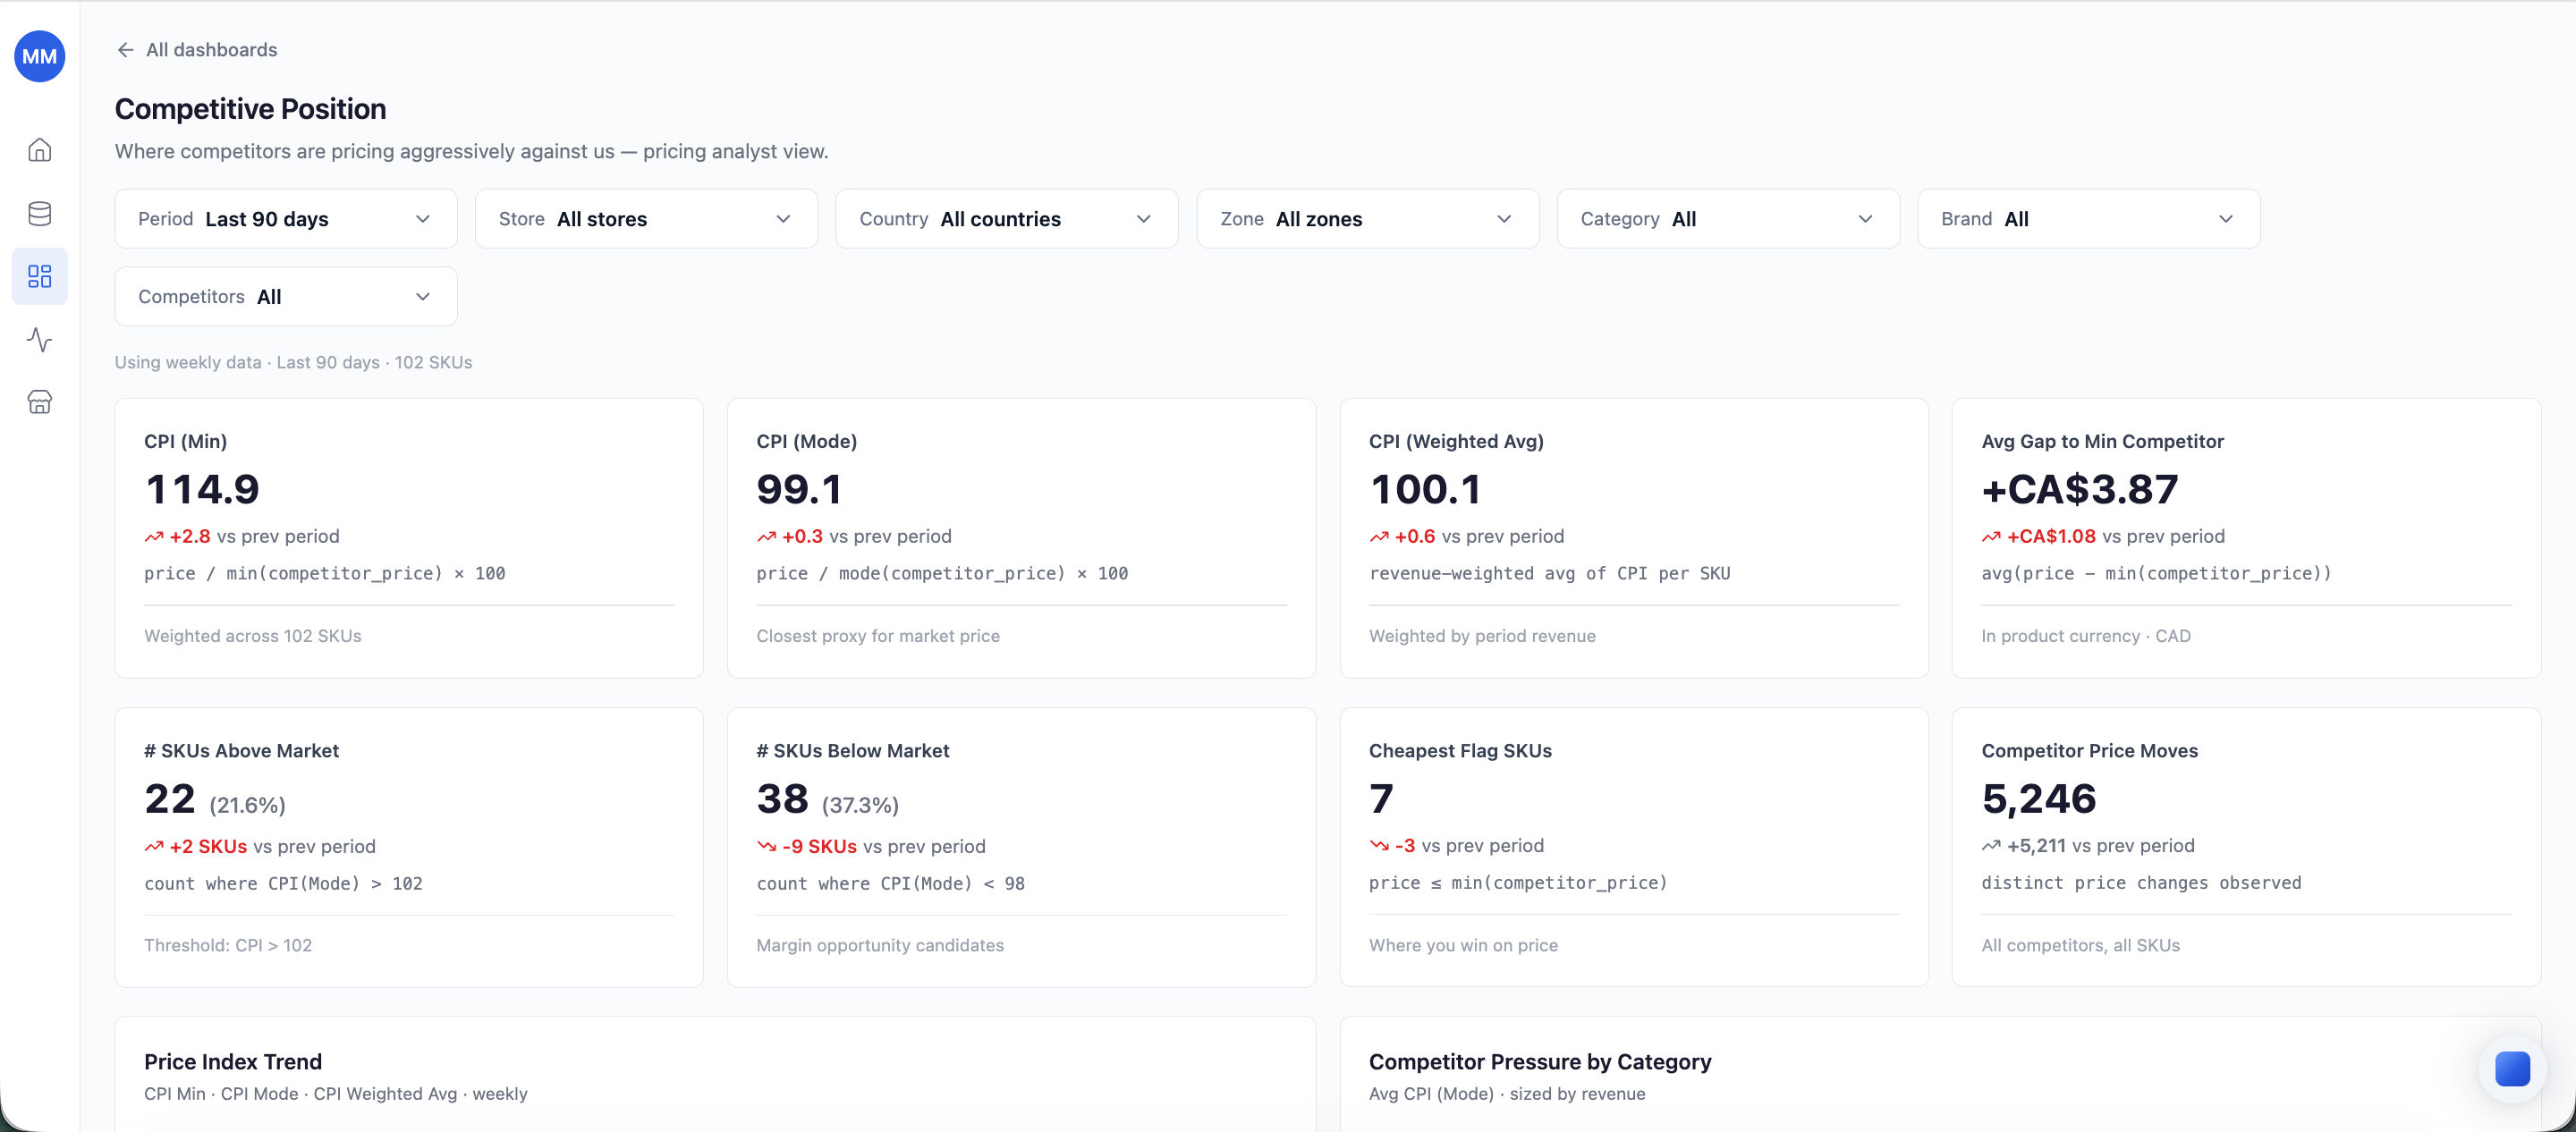
* **Competitive Position** - where competitors are pricing aggressively against you: CPI variants, gap to the cheapest competitor, SKUs above and below market, and competitor price moves, with trend charts below.
* **Margin Leakage by Category** - margin leakage by category versus competitor price index, so you can focus the next pricing pass on the categories that matter.
Built-in dashboards are **editable** - open one in the [dashboard editor](/dashboards/editor) to change its widgets, filters, or layout. They can't be permanently deleted: a **Reset** action restores the original configuration at any time, and a removed built-in dashboard is automatically recreated from its default template.
## Filters
Every dashboard has a global filter bar:
* **Period** - presets from yesterday to all time; every widget follows the selected window.
* **Store**, **Country**, **Zone**, **Category**, **Brand**, and **Competitors** filters narrow the scope - store-level filters become meaningful once [store-level data](/data-requirements/product-store-data) is loaded.
Filters are global to the dashboard: change a filter and every widget refreshes with the new scope. There are no per-widget filters - a dashboard is one analytical view, and its widgets are different visualizations of the same filtered dataset.
## Built-in dashboards
Retailgrid ships analyst-grade dashboards out of the box:
* **Competitive Position** - where competitors are pricing aggressively against you: CPI variants, gap to the cheapest competitor, SKUs above and below market, and competitor price moves, with trend charts below.
* **Margin Leakage by Category** - margin leakage by category versus competitor price index, so you can focus the next pricing pass on the categories that matter.
Built-in dashboards are **editable** - open one in the [dashboard editor](/dashboards/editor) to change its widgets, filters, or layout. They can't be permanently deleted: a **Reset** action restores the original configuration at any time, and a removed built-in dashboard is automatically recreated from its default template.
## Filters
Every dashboard has a global filter bar:
* **Period** - presets from yesterday to all time; every widget follows the selected window.
* **Store**, **Country**, **Zone**, **Category**, **Brand**, and **Competitors** filters narrow the scope - store-level filters become meaningful once [store-level data](/data-requirements/product-store-data) is loaded.
Filters are global to the dashboard: change a filter and every widget refreshes with the new scope. There are no per-widget filters - a dashboard is one analytical view, and its widgets are different visualizations of the same filtered dataset.
 ## Create with AI
When the built-in dashboards don't answer your question, describe what you want to see in plain language and Retailgrid generates a dashboard for you. The AI assistant also works on existing dashboards - it can add, remove, or replace widgets from a prompt inside the [dashboard editor](/dashboards/editor).
Full walkthrough: [Create a dashboard with AI](/dashboards/create-with-ai).
## Refresh and freshness
Dashboards read live from your datasets - no manual refresh step. The freshness signal on each dashboard matches the freshness of the underlying datasets:
* Datasets refreshed overnight - dashboards reflect last night's data when you open them in the morning.
* Replaced a dataset manually - the next dashboard load reflects the new data.
If a chart looks stale, check the dataset on the [Datasets](/data-requirements/datasets) page.
## Sharing
Dashboards are visible to everyone in your [Organization](/settings/organization). Anyone on your team can open them; only the creator (and admins) can rename or delete a custom dashboard.
## Related
* [Dashboard editor](/dashboards/editor)
* [Create a dashboard with AI](/dashboards/create-with-ai)
* [Datasets](/data-requirements/datasets)
* [Metrics glossary](/reference/metrics)
* [Grids overview](/grids/create-grid)
## Create with AI
When the built-in dashboards don't answer your question, describe what you want to see in plain language and Retailgrid generates a dashboard for you. The AI assistant also works on existing dashboards - it can add, remove, or replace widgets from a prompt inside the [dashboard editor](/dashboards/editor).
Full walkthrough: [Create a dashboard with AI](/dashboards/create-with-ai).
## Refresh and freshness
Dashboards read live from your datasets - no manual refresh step. The freshness signal on each dashboard matches the freshness of the underlying datasets:
* Datasets refreshed overnight - dashboards reflect last night's data when you open them in the morning.
* Replaced a dataset manually - the next dashboard load reflects the new data.
If a chart looks stale, check the dataset on the [Datasets](/data-requirements/datasets) page.
## Sharing
Dashboards are visible to everyone in your [Organization](/settings/organization). Anyone on your team can open them; only the creator (and admins) can rename or delete a custom dashboard.
## Related
* [Dashboard editor](/dashboards/editor)
* [Create a dashboard with AI](/dashboards/create-with-ai)
* [Datasets](/data-requirements/datasets)
* [Metrics glossary](/reference/metrics)
* [Grids overview](/grids/create-grid)